Data analysis · Hotspots in the Pantanal
Foco Atlas
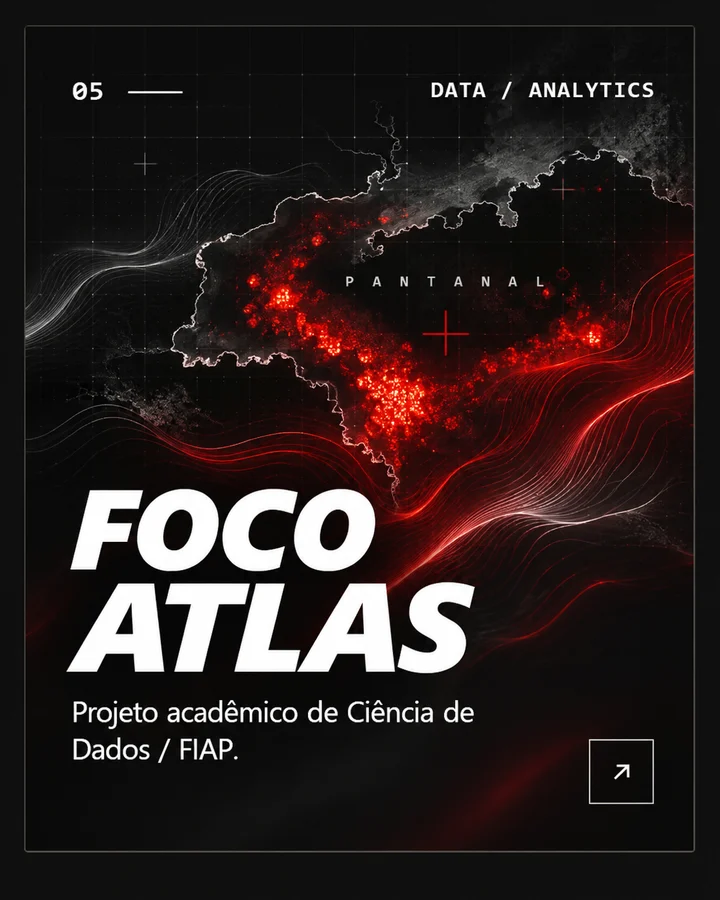
Foco Atlas analyses hotspot records in the Pantanal and organises the results by period and municipality. From INPE data, the project builds an index to support territorial prioritisation and presents the analyses in a portal with a map, series and an executive reading.
- Type
- Academic project · Data Science / FIAP
- Status
- Analysis completed in a notebook
- Scope
- Pantanal, 2020 to 2025, AQUA_M-T satellite
What was done
Six yearly BDQueimadas files were consolidated into a single dataset, the scope was validated, dates and missing values were handled, and hotspots were analysed by year, month, state and municipality. Then an index of its own was built to rank municipalities by thermal pressure.
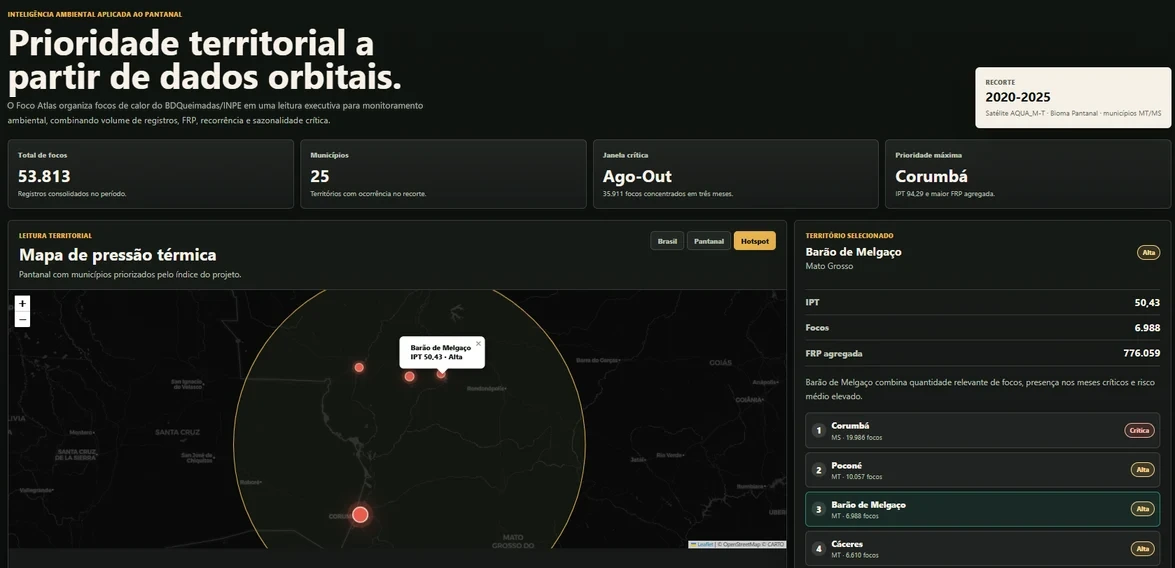
There were 53,813 hotspots across 25 municipalities. August to October accounted for 66.7% of them, and four municipalities (Corumbá, Poconé, Barão de Melgaço and Cáceres) held 81.1%.
The project portal
The analysis output was organised into a portal with a map, series and an executive reading. Each tab shows one part of it. Captures of the project’s academic portal, which is not available online; map with data from OpenStreetMap and CARTO.
Hotspots per year
- 202022.116
- 20218.258
- 20221.637
- 20236.580
- 202414.498
- 2025724
Thermal Pressure Index
The IPT folds five components into a 0 to 100 score per municipality: 40% hotspot volume, 25% summed radiative power (FRP), 15% hotspots in critical months, 10% average fire risk and 10% yearly recurrence. These weights are from the second version, because the first let municipalities with few records climb the ranking on high proportions alone.
- Corumbá94,29
- Poconé55,83
- Barão de Melgaço50,43
- Cáceres43,22
Limits
A hotspot is not a fire
Each record is a satellite detection. It is not a confirmed fire or a burned area.
The IPT does not forecast
It is an index for prioritising attention from the historical record. It does not anticipate future events or replace fieldwork.
A single satellite
The analysis uses only AQUA_M-T to keep the years comparable. Other BDQueimadas sensors were left out.
Technologies
- Data analysis
- Visualisation and notebook