IT analytics platform · Management and governance
Vortex.
Vortex brings security, infrastructure, budget, licence and IT operations indicators together in an internal platform. Its dashboards let people follow results and explore the data; behind the scenes, collection and data-processing routines keep those views up to date.
- Type
- Internal platform
- Areas
- Security · Infrastructure · IT management
- On this page
- Platform description and a synthetic-data demo

ConfidentialityInternal corporate platform with implemented features. This page shows no source code, real data or infrastructure details. The screens and the interactive demo are independent recreations, with names, numbers and charts that are entirely synthetic; they are not captures of the original system.
Context
IT information was spread across separate tools and controls. Vortex organises those sources into an analytical base and presents dashboards to follow security, infrastructure, licences and spending.
The data layer relies on extraction, transformation and storage; the interface brings together filters, indicators and visualisations for operational and executive analysis.
Challenge
The challenge was to bring together data with different formats and refresh cycles while keeping consistency, traceability and access control. The platform also had to offer dashboards that let people investigate variations and follow indicators without relying on spreadsheets or manual queries for every analysis.
Pillars and capabilities
The capabilities that make up the platform, grouped by role. They are described without real data or infrastructure details.
P1
Data and processing
The technical foundation of the platform. It is not a screen module: it brings data from distinct sources into a common analytical model that underpins the indicators.
- Extraction and transformation pipelines
- Integrations across different sources
- PostgreSQL and analytical modelling
- Indicator refresh and processing
P2
Security and indicators
Brings together information security views and the platform’s own authentication, permission and auditing mechanisms.
- WAF and security event analysis
- Threat intelligence
- Vulnerability management
- LDAP / Active Directory authentication
- Multi-factor authentication (MFA) support
- Access profiles and permissions
- Auditing and traceability
P3
Platform and interactivity
Backend, APIs and interface that deliver indicators to decision makers.
- Python backend and APIs
- Modular architecture
- Interactive dashboards
- Cross-filtering across charts, indicators and tables
- Scheduling and automation
P4
IT management and operations
Operational, managerial and executive views of infrastructure, licences and budget.
- Executive views
- Operational indicators
- License management
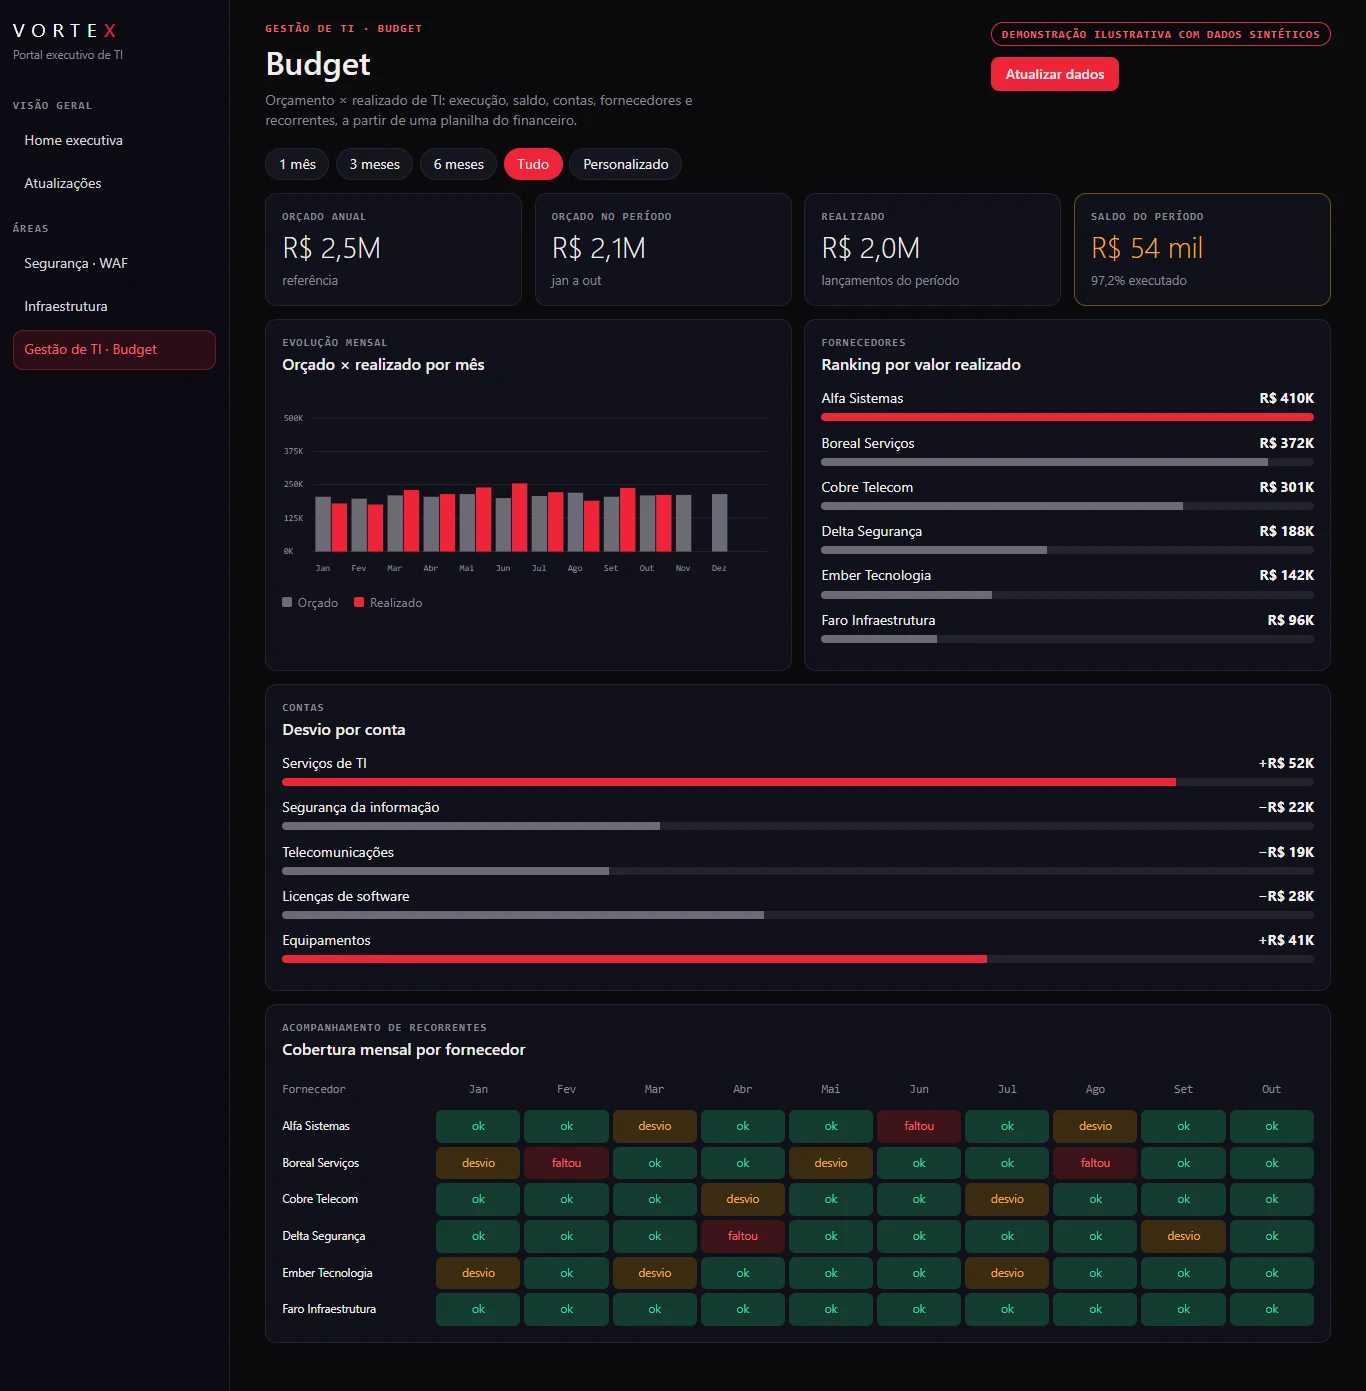
- Financial and budget tracking
Architecture
Sources
Security tools, IT operations systems and management records.
Ingestion and transformation
Python extraction and transformation pipelines, run on schedules.
Analytical layer
PostgreSQL with indicator-oriented modelling.
Services
Modular Python backend exposing APIs to the interface.
Experience
Interactive dashboards with cross-filtering and executive views.
Cross-cutting
Identity and access
Authentication with LDAP / Active Directory and MFA support, plus access profiles.
Auditing
Logging and traceability of actions on the platform.
Simplified, sanitised diagram of the platform layers. It does not show real topology, hosts, networks, vendors or flows.
Platform screens
Five areas recreated for this page, following the product’s reading logic: filters on top, indicators, charts and detail.
Demo with fictitious data
On a phone, swipe the screen sideways to see everything.
Cross-filtering in practice
Cross-filtering is one of Vortex’s features: selecting an element in one chart slices the other charts, the indicators and the tables. The demo below recreates that behaviour independently, with synthetic data and a generic security events scenario; it reproduces no screens or data from the original platform.
Synthetic data · Demo
Security events demo dashboard
Click a bar, column or table row to filter. Every chart, indicator and the table recalculate together. Click again to remove the filter.
Showing 640 of 640 synthetic events.
- Events
- 640
- Block rate
- 52.5%
- Critical
- 49
- Targets hit
- 5
Events by category
Events by severity
Events per day (simulated 14-day window)
Summary by target
| Target | Events | Critical | Blocked |
|---|---|---|---|
| 181 | 13 | 51.9% | |
| 159 | 7 | 53.5% | |
| 138 | 15 | 49.3% | |
| 94 | 11 | 58.5% | |
| 68 | 3 | 50% |
Technologies
- Backend and APIs
- Data and processing
- Frontend and visualisation
- Infrastructure and authentication